


Affirmative Action at Harvard

Affirmative Action is an issue that universities defend despite it being very unpopular when honestly described as a system of demographic preferences that considers factors like the race and sex of applicants.
Universities likely understand that demographic preferences are unpopular at some level, which I suspect is one reason why data on the issue usually only seems to come out during lawsuits or hacks. Some relatively recent data that we have gotten came out a few years ago from Harvard.

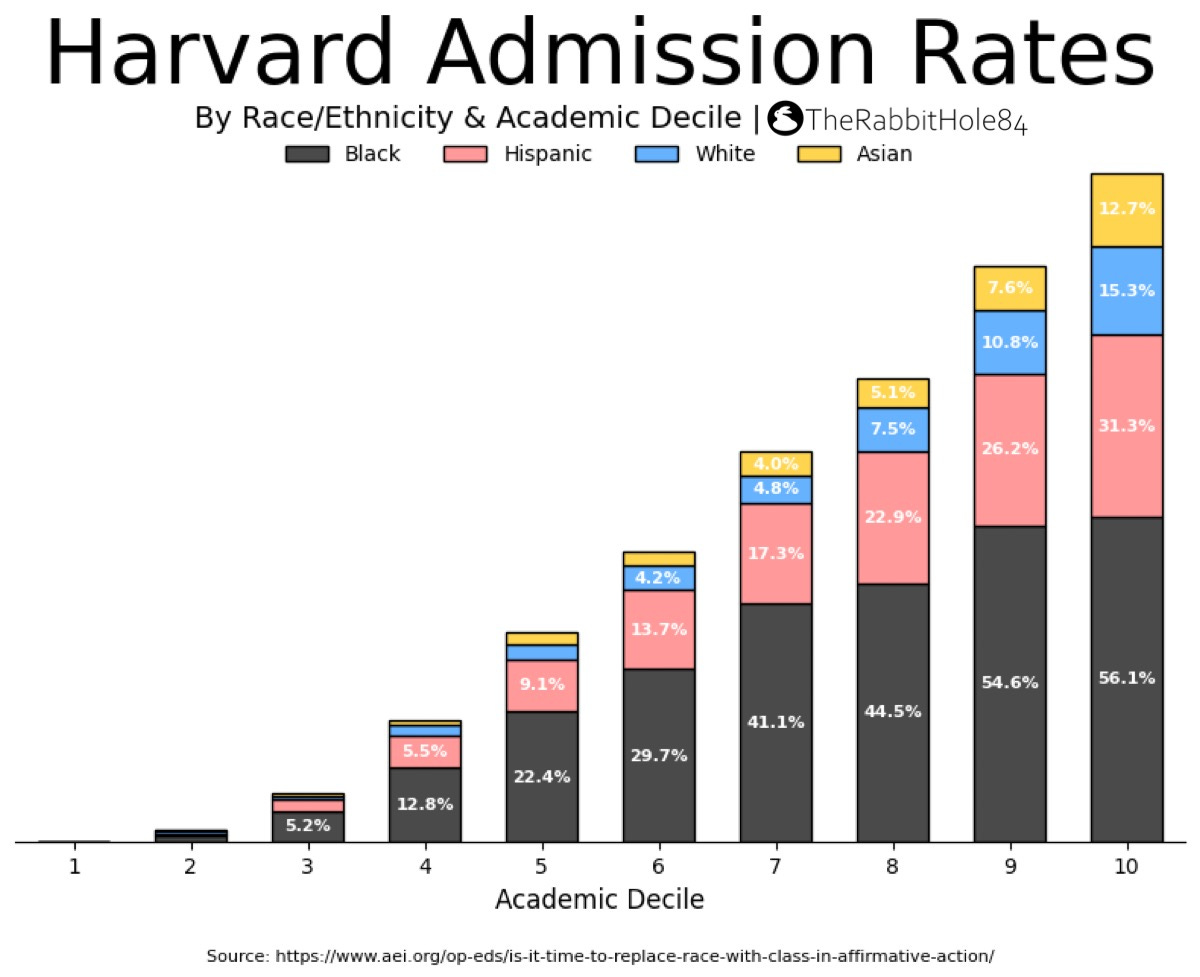
The Harvard Affirmative Action data is interesting because it is cleanly organized by race/ethnicity and academic deciles in a tabular format. The higher deciles represent more qualified candidates, and the lower deciles represent less qualified candidates. I thought it might be a worthwhile exercise to create some visualizations. Starting off, we can look at the chances of admission by race/ethnicity within each of the 10 Academic Deciles.
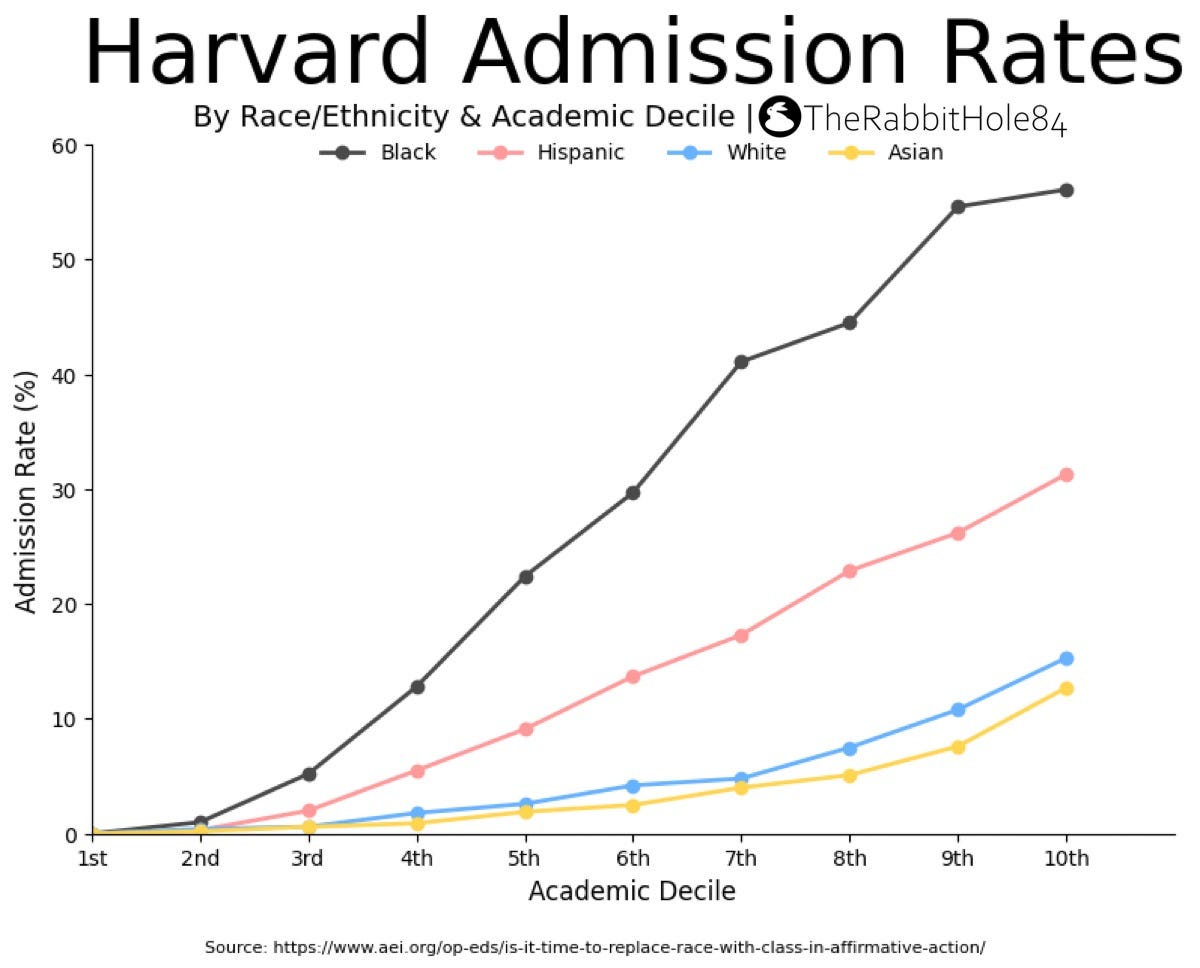
From looking at this, we can note the general trend that Blacks and Hispanics generally have higher chances of admission than similarly qualified peers who are Asian or White.
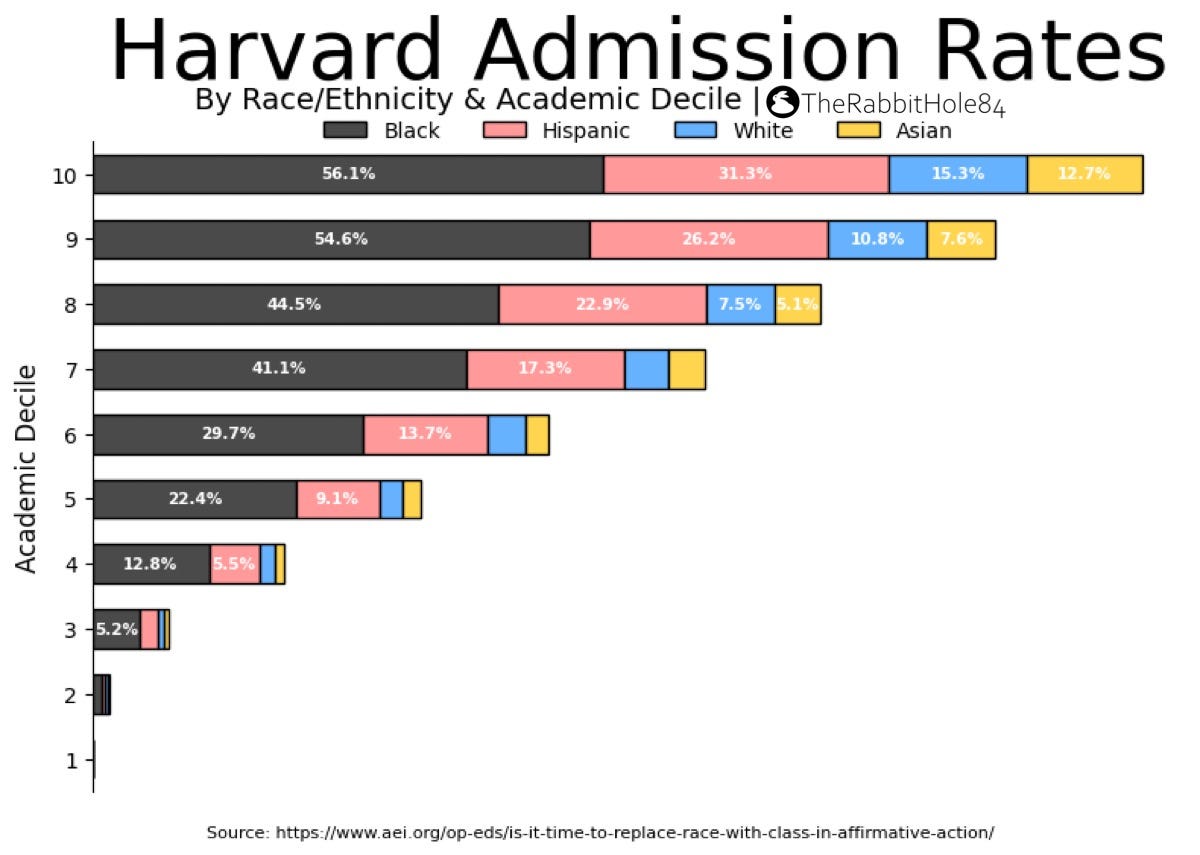
Zooming in on the 10th Decile:

Focusing on the 10th Academic Decile, which represents the most qualified applicants to Harvard, lets us more easily observe that Harvard applicants have different chances of admission depending on their race:
Asians: 12.7%
Whites: 15.3%
Hispanics: 31.3%
Blacks: 56.1%
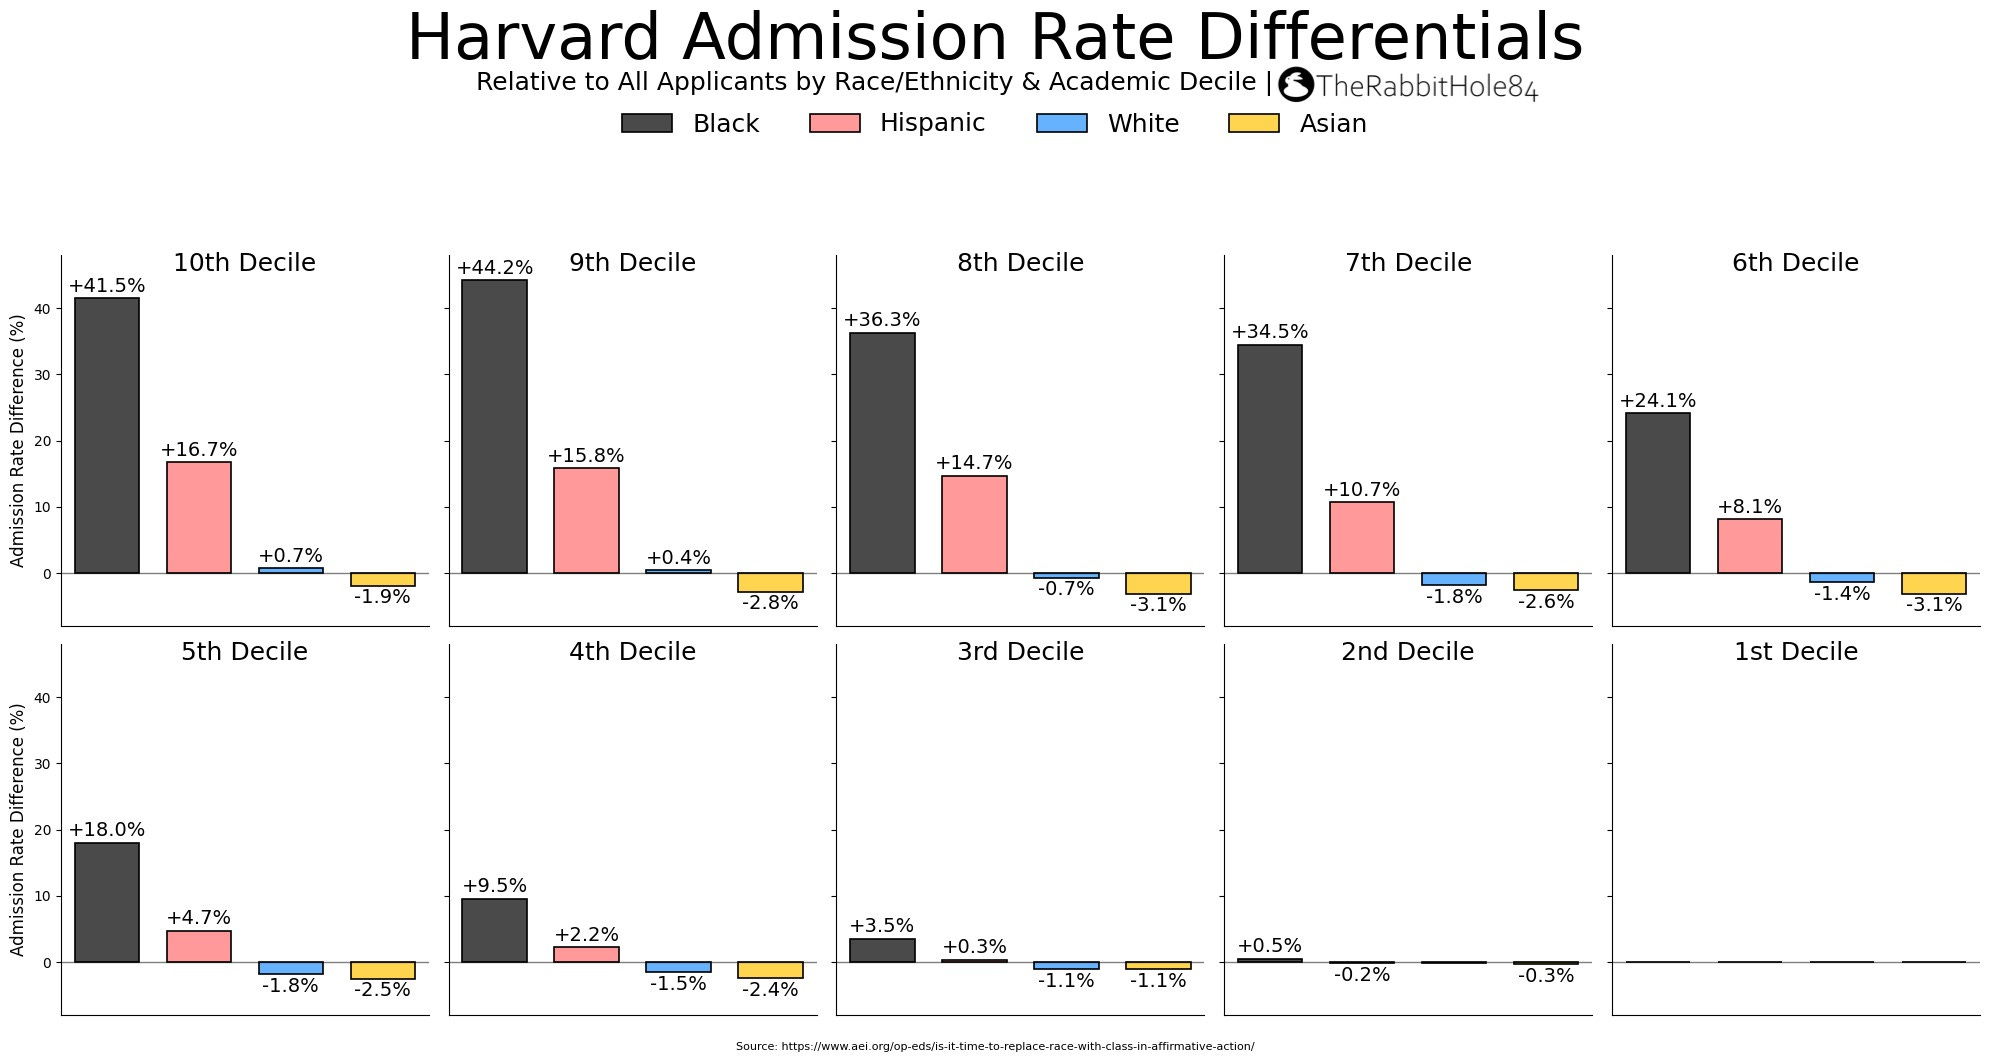
The disparate gaps in chances of admission between Asians/Whites and Blacks/Hispanics are quite large:
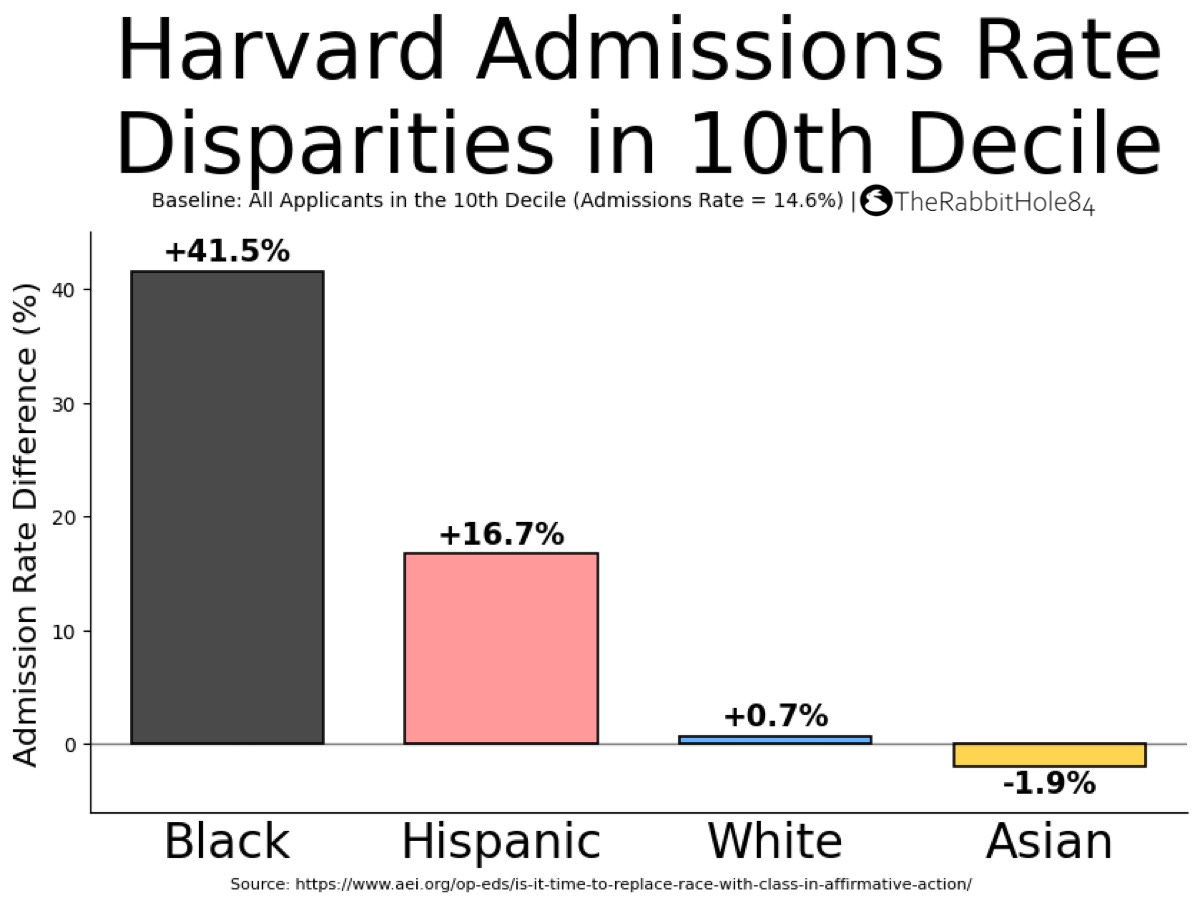
Relative to All Applicants in the 10th Decile (Admissions Rate = 14.6%):
Blacks have a 41.5% advantage
Hispanics have a 16.7% advantage
Whites have a 0.7% advantage
Asians have a 1.9% disadvantage
Needless to say, Harvard grants a huge demographic preference to individuals who are Black or Hispanic.
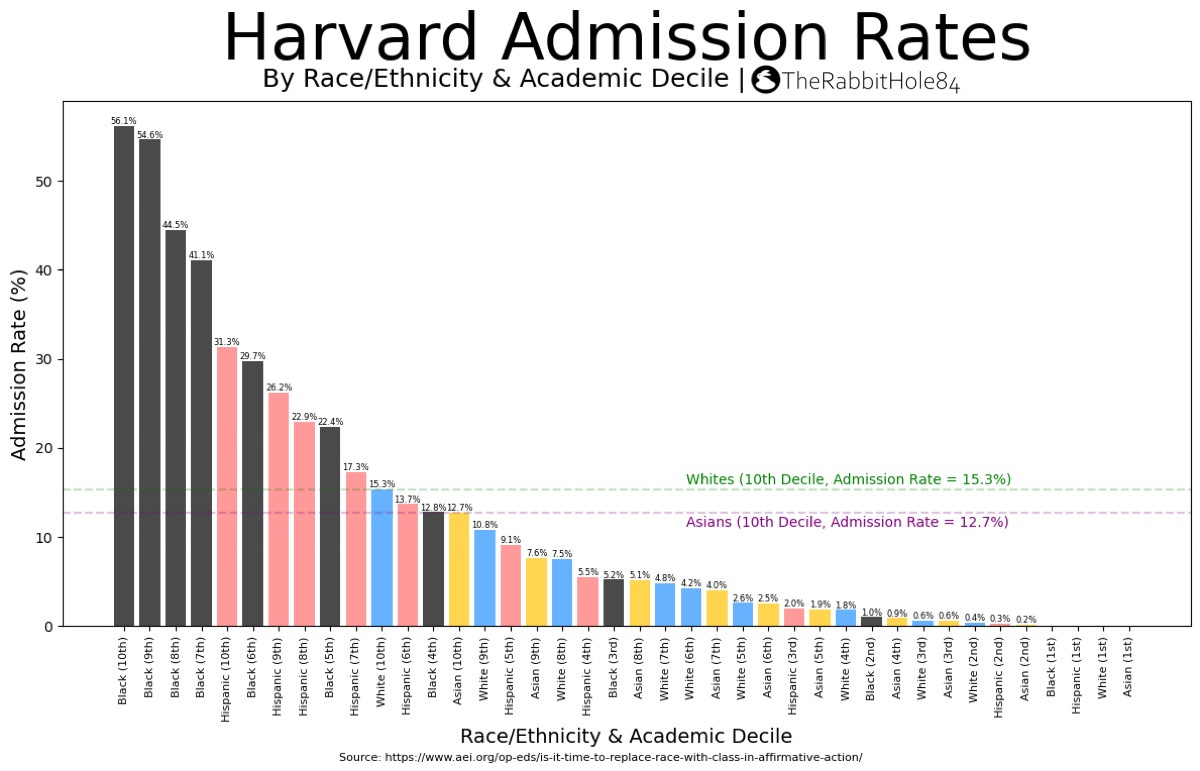
Blacks in particular are granted such a large advantage by Harvard over their White peers that a Black applicant in the 5th decile still has a higher chance of admission than a White applicant in the 10th decile.

If we use Asians in the 10th academic decile as a reference point, we notice that the most qualified Asian individuals have a worse chance of getting into Harvard than Black individuals in the 4th decile from the bottom half of the applicant pool.
When we look at the facts around Affirmative Action, it is clear that universities, like Harvard, are granting extreme racial preferences to their preferred groups. If we review responses to Gallup:

We can see that Americans, regardless of race, viewed the Supreme Court Decision against Affirmative Action race preference programs as a good thing. This means that any university attempting to covertly continue its Affirmative Action programs is not only engaging in blatant discrimination against Asians and Whites but also going against the will of the American people.
Any university thinking about continuing Affirmative Action under the excuse of defending minorities should consider this:
“The smallest minority on earth is the individual. Those who deny individual rights cannot claim to be defenders of minorities.”
― Ayn Rand
Colorblindness and Meritocracy should be the values of the future. We should prioritize individuals over collectives. Hopefully, universities will come around to the American point of view on this issue and stop attempting to demographically engineer their campus populations.
Appendix
Adding additional visuals of the Harvard Affirmative Action Data in this section, in case they are of interest to anyone. I may periodically update this section with more charts.

An interesting future data point will be how many of the black students admitted will go into politics after graduation. If it’s a high percentage of them, then we could ask if Harvard is trying to act like the Bene Gesserit and manufacture the next Obama.